Analytics
The Analytics page presents dashboards on user satisfaction and RAG system answer quality.
WARNING
This feature is restricted to administrators.
Access analytics
From the administration page, click the Analytics button in the top bar.
Analysis period
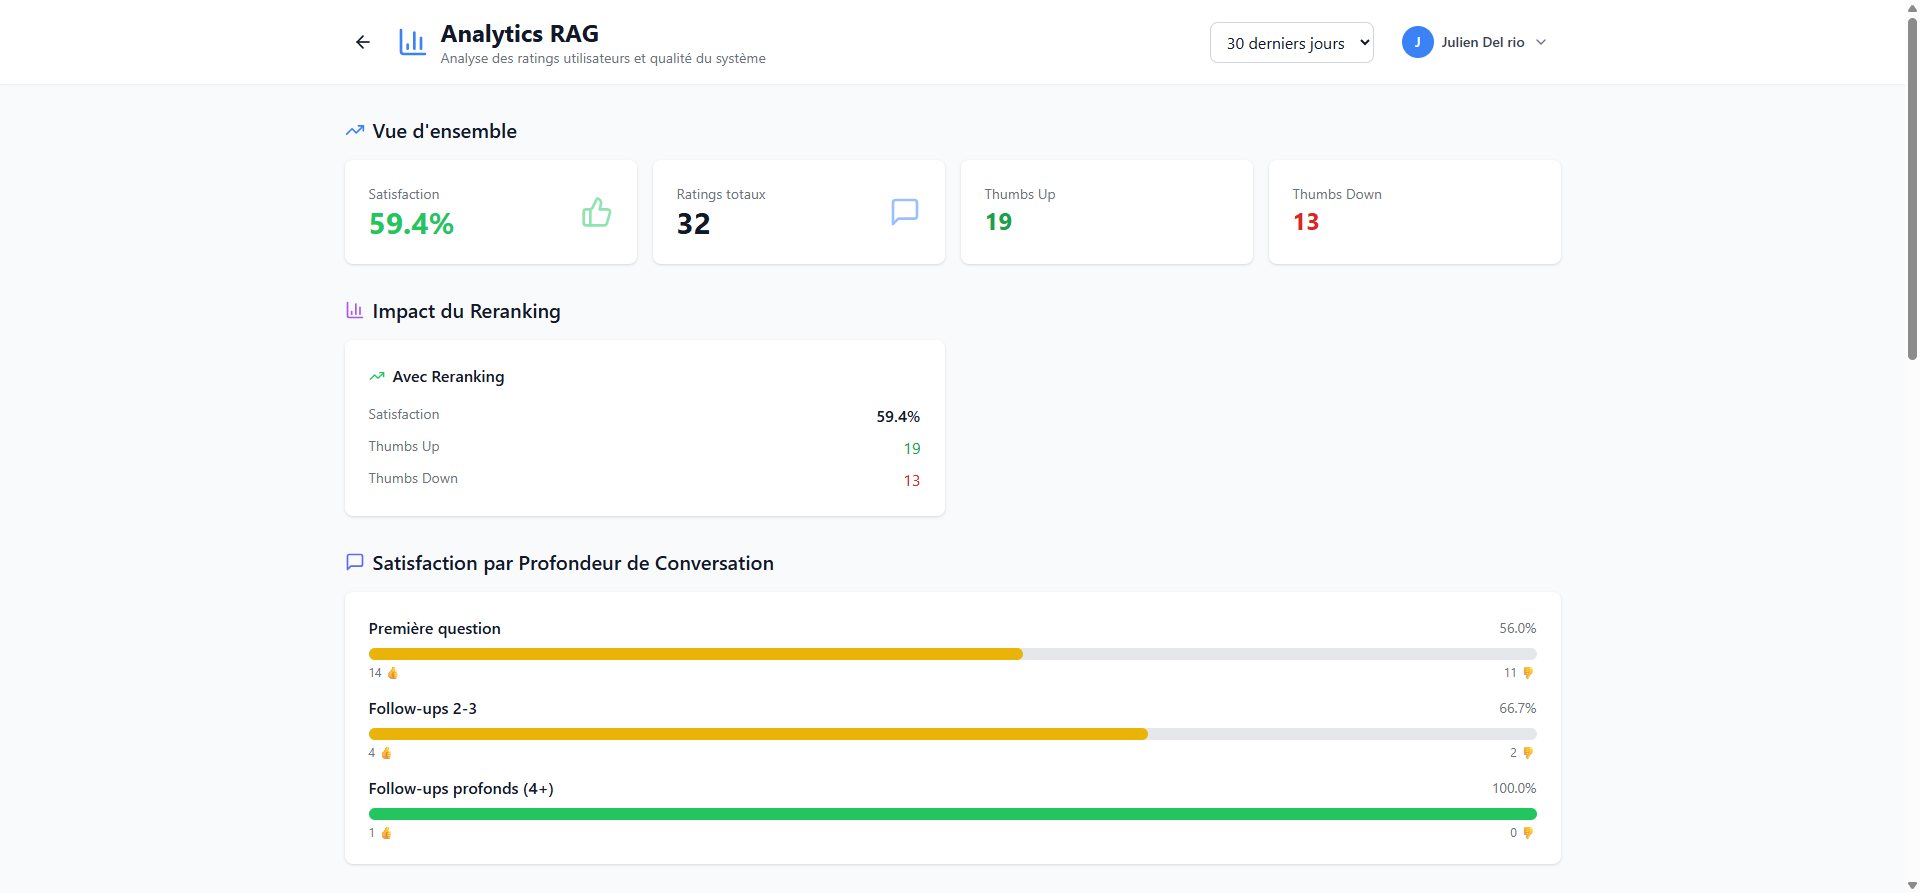
A selector in the top right allows you to choose the analysis period (e.g. 30 derniers jours / Last 30 days).
Overview
Four key indicators are displayed:
| Indicator | Description |
|---|---|
| Satisfaction | Percentage of positively rated answers |
| Ratings totaux (Total ratings) | Total number of ratings (thumbs up + thumbs down) |
| Thumbs Up | Number of positively rated answers |
| Thumbs Down | Number of negatively rated answers |
Reranking impact
This section shows satisfaction statistics when deep search (reranking) is enabled, allowing you to measure its impact on answer quality.
Satisfaction by conversation depth
This chart shows the satisfaction rate by question position in the conversation:
- Premiere question (First question): satisfaction for the initial question
- Follow-ups 2-3: satisfaction for follow-up questions
- Follow-ups profonds (4+) (Deep follow-ups): satisfaction for long conversations
TIP
A declining satisfaction rate in deep follow-ups may indicate a need to improve conversational context management.
Problematic documents and chunks
Further down the page, tables identify:
- The chunks (document segments) with the worst ratings
- The documents with the highest dissatisfaction rate
This information helps target documents that need improvement or re-ingestion.